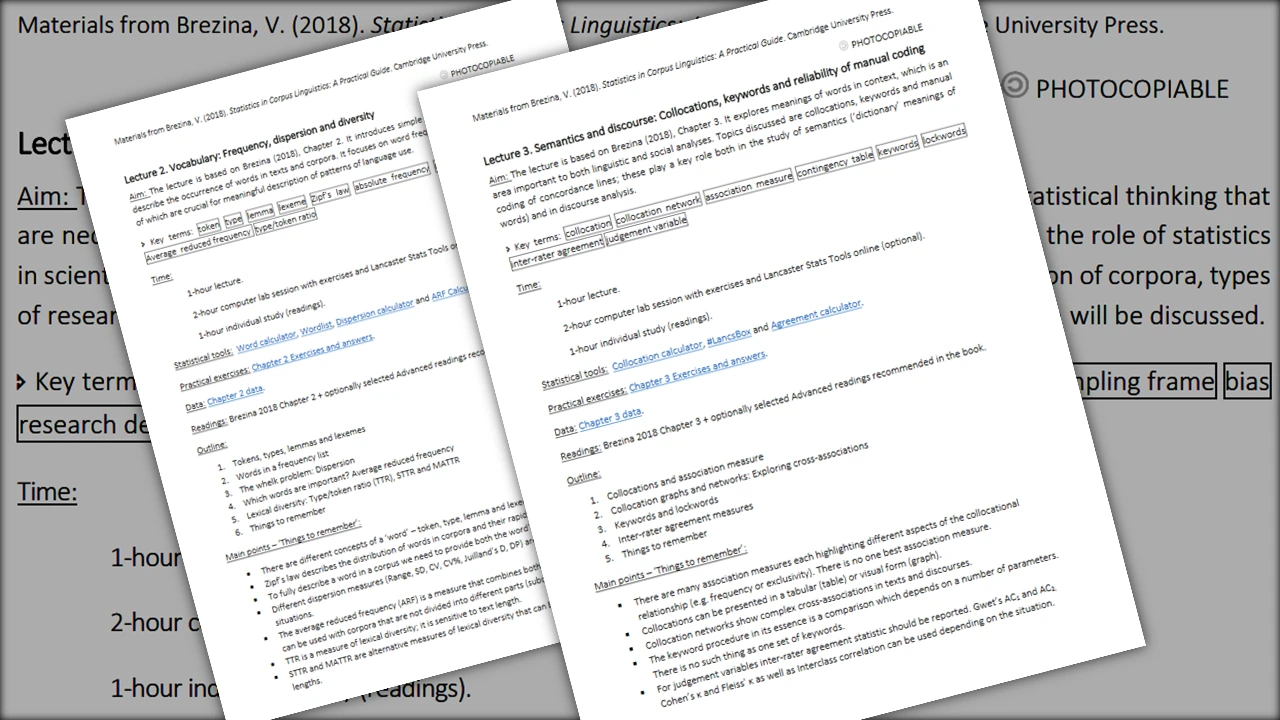
Lancaster Stats Tools - Analyse corpus data with ease.

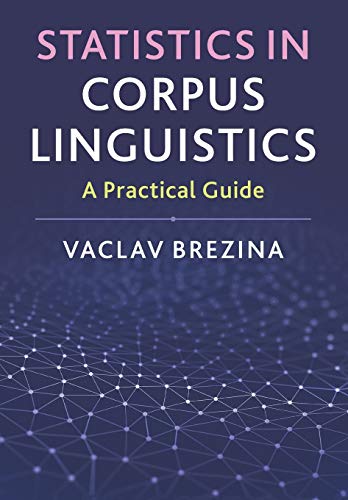
Brezina, V. (2018) Statistics in Corpus Linguistics: A Practical Guide. Cambridge: Cambridge University Press.


Press enter to evaluate

Help & Docs

This tool is for descriptive graphs, and intelligently guesses the graph you want. Try the graph tool for more options, including inference.

Help & Docs

Press enter to search

Citations

...

Welcome to Lancaster Stats Tools

Do you use corpora in your research or study, but find that you struggle with statistics? This practical introduction will equip you to understand the key principles of statistical thinking and apply these concepts to your own research, without the need for prior statistical knowledge. The book gives step-by-step guidance through the process of statistical analysis and provides multiple examples of how statistical techniques can be used to analyse and visualise linguistic data. It also includes a useful selection of discussion questions and exercises which you can use to check your understanding.

Lancaster Stats Tools is a companion website to the book. It contains additional materials (video lectures, exercises, data, and slides and lesson plans) as well as easy-to-use tools for calculating statistics and producing graphs.

Enter a mathematical expression, to be evaluated in R.

Help & Docs

Generate a graph

Help & Docs

R code

1. Paste in tab-delimited (aka TSV) data, including the header row and ID column.

2. Select configuration for your graph

Linguistic variables:

Graph type:

Generate randomized data

Help & Docs

1. Select randomisation type:

2. Paste in data to randomize.

3. Select what to randomize:

2. Select what to randomize:

3. Enter minimum and maximum value:

to

4. Choose configuration:

Number to generate:

...

Example data

Concordance for the lemma GO [csv] [xlsx]

'The' in BE06 [csv] [xlsx]

Passives in BE06 - genres [csv] [xlsx]

'The' and 'I' in BNC64 [csv] [xlsx]

'Go'/'travel' in BNC [csv] [xlsx]


'Lovely' in BNC64: Male and female speech [csv] [xlsx]

'Lovely' in BNC64: Age [csv] [xlsx]


Modals in the Brown family - frequencies [csv] [xlsx]

Modals in the Brown family - concordances [csv] [xlsx]

Modals in the Brown family - summary [csv] [xlsx]


Data visualization [xlsx]

Exercises

Text analysis

1. Paste the text you want to analyse into the text box below.

2. Select configuration for your analysis:

Language
Word delimiters
TTR normalisation basis

Create a wordlist

1. Paste the text you want to analyse into the text box below.

2. Select configuration for your analysis:

Language
Word definition
Normalisation basis

Calculate dispersion

1. Paste in relative frequency values, separated by semicolon (;).

2. Enter word:

Word

Calculate ARF

1. Paste in relative frequency values, separated by semicolon (;).

2. Enter configuration:

Word
Absolute frequency
Corpus tokens

Example data

BNC frequency list (BNCweb) [txt]

DP calculations [xlsx]

Exercises

Open in new tabAnswers

Calculate collocations

Help & Docs

Enter parameters for calculation:

Tokens in corpus
Frequency of is
Frequency of is
Frequency of collocation (node + collocate)
L: R:

Agreement calculator

Help & Docs

R code

1. Paste tab delimited data, including header row and id column.

2. Select judgement variable type:

#LancsBox X is a multi-platform tool for analysing language.

#LancsBox can identify collocations and keywords, among other things. Unfortunately it's not available on the web, so you'll need to download it to your computer for free.

Find out more about #LancsBox X here.

Example data

Inter-rater agreement (exercise 9) [csv] [xlsx]

Inter-rater agreement (example) [csv] [xlsx]

Guardian comments [txt]

Daily Mail comments [txt]

Exercises

Open in new tabAnswers

Cross-tabulate data

Help & Docs

Paste tab-separated data into here:

Compare categories

Help & Docs

R code

Paste tab-separated data into here:

Input format:

2. Select the test to run:

Test

Build a model

Help & Docs

1. Select how you want to build your model:

2. Paste in data:

3. Enter config:

Outcome variable
Predictor variable(s)
You can use ; to separate several variables

4. Include predictor interactions?

2. Paste in data:

3. Enter outcome variable:

Outcome variable

4. Select step-wise model building method

...

Example data

The vs. a(n) dataset [csv] [xlsx]

Modals dataset [csv] [xlsx]

Modals dataset with genre coding [csv] [xlsx]

Modals dataset with variety coding [csv] [xlsx]

Cross-tab of modals of obligation [csv] [xlsx]

Cross-tab of which and that [csv] [xlsx]

Which and that dataset for logistic regression [csv] [xlsx]

Exercises

Open in new tabAnswers

Correlation calculator

Help & Docs

R code

1. Paste tab-separated data into here (inlcuding the header row and ID column):

2. Select configuration

Data type:

Paste tab-separated data into here:

2. Select configuration:

Distance measure
Method

3. How cluster groups do you want highlighted?

Highlights

Multidimensional analysis

Help & Docs

R code

1. Paste tab-separated data into here (including the header row and ID column):

2. Select analysis type

Example data

Correlations [csv] [xlsx]

Clusters [csv] [xlsx]

MD BE06 (British English)[csv] [xlsx]

MD AmE06 (American English)[csv] [xlsx]

New Zealand English - ICE-NZ [xlsx]

Exercises

Open in new tabAnswers

Group comparison calculator

Help & Docs

R code

1. Paste tab-separated data into here (inlcuding the header row and ID column):

2. Select configuration

Data describes:

Test type:

Correspondence analysis chart

Help & Docs

R code

Paste tab-separated data into here:

Mixed effect logistic regression

Help & Docs

R code

1. Paste in data:

2. Enter config:

Outcome variable
Fixed effect predictor(s)
You can use ; to separate several variables
Random effect predictor

3. Include predictor interactions?

Example data

T-test or Mann-Whitney U test [csv] [xlsx]

ANOVA or Kruskal-Wallis[csv] [xlsx]

Correspondence analysis [csv] [xlsx]

Mixed effect model [csv] [xlsx]

White House Press Conferences [csv] [xlsx]

Exercise 6 [xlsx]

Exercises

Open in new tabAnswers

Bootstrapping test

Help & Docs

R code

1. Paste tab-separated data into here (inlcuding the header row and ID column):

2. Select configuration

Hypothesis:

Number of Bootstrapping samples

Neighbour clusters

Help & Docs

R code

Paste tab-separated data into here:

Distance measure
Clustering method

Peaks and Troughs

Help & Docs

R code

1. Paste in data:

2. Enter config:

Data fit parameter

Usage fluctuation analysis

Help & Docs

R code

1. Indicate historical period:

From to
Window

2. Upload a zip file with collocation files:

3. Provide information about your data:

Row number of header row
Regex to identify collocates
Column delimiter
Column number of the column with...
Collocates
Collocation frequencies
Relevant association measure

4. Define a collocate:

Statistic cut-off value
Latency threshold (LT) sampling points
Consistency threshold (CT) %, sampling points

5. Run analysis with frequency cut-off point?

Frequency cut-off value
Regex to identify node frequency in header (relative cutoff)

Example data

Modals in BrE 1931 - 2006 [csv] [xlsx]

Bootstrap test data [csv] [xlsx]

VNC cluster data [csv] [xlsx]

Peaks & troughs data [csv] [xlsx]

UFA data: 'whore' in the 17th century [zip]

Colours - dataset [xlsx]

Exercises

Open in new tabAnswers

Effect size calculator

Help & Docs

R code

Input type
Required value(s)
You can use ; to separate several variables

Meta-analysis calculator

Help & Docs

R code

Paste tab-separated list of studies into here:

Use their standardised results (d, n1, n2)

Example data

Meta-analysis [csv] [xlsx]

Exercises

Open in new tabAnswers

Copy link to tool

Video Lectures

Watch instructional videos about statistics and why it matters in language and everyday life.

Watch lectures
Slides

Download pptx slides on a range of statistical topics related to each of the eight chapters in the book.

View downloads
Lesson Plan

Download lesson plans for teachers related to each of the eight chapters in the book.

View downloads
Readings

Explore corpus statistics through additional readings.

Explore readings